Statistics Formula Class 9 PDF Free Download
Are you looking for important formulas of Statistics for Class 9? You’re in the right place! In this post, we’ve compiled all essential formulas from Chapter 16 of Class 9 Maths – Statistics. You can download the free PDF and revise quickly for your exams.
1. Tabulation : The arrangement of the raw data under various heads in the form of a table is called tabulation.
2. Tange of a Data : The difference between the largest and the smallest observations is called the range.
3. Frequency : The number of observation in a particular class is called its frequency.
4. Cumulative Frequency : The cumulative frequency of a particular class is the sum of all frequencies up to this class.
5. Frequency Distribution : The distribution of frequency in various classes is known as frequency distribution.
6. Types of Frequency Distribution :
(i). Exclusive or Continuous Form : Here, the classes are of the form 0 – 10 , 10 – 20 , 20 – 30 ……………..etc.
Here , 10 – 20 means 10 and more but less than 20
Thus , in 10 – 20 we include 10 and exclude 20.
Here in 10 – 20 , we have
lower limit = 10 Upper limit = 20
True lower limit = 10 True upper limit = 20
Class Size = (20 – 10 ) = 10
(ii). Inclusive or Discontinuous form : Here, the classes are of the form 0 -10, 11- 20, 21 – 30 ……………etc.
Here , 11 – 20 means 11 and more but less than 20 and 20
Thus, in 11 – 20 both 11 and 20 are included.
in 11 – 20 , we have
lower limit = 11 Upper limit = 20
True lower limit = 10.5 True upper limit = 20.5
Class size = (20.5 – 10.5) = 10
(iii). Class mark of a Class :

(iv). Range = (maximum value ) – ( minimum value )
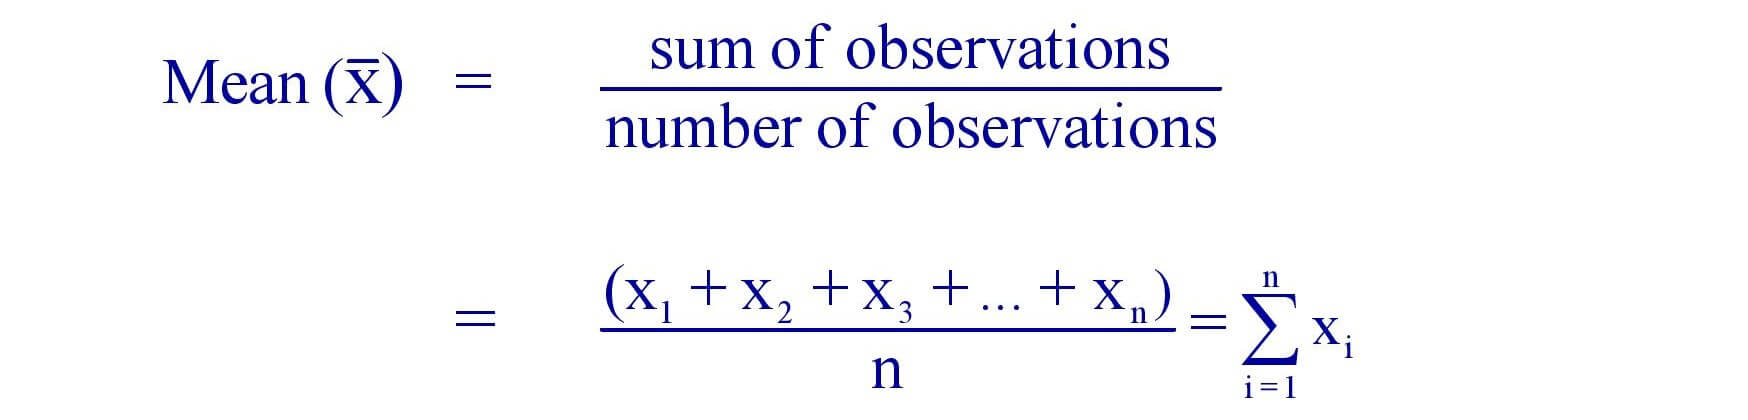
7. Arithmetic Mean : The average of a given set of numbers is called the arithmetic mean.
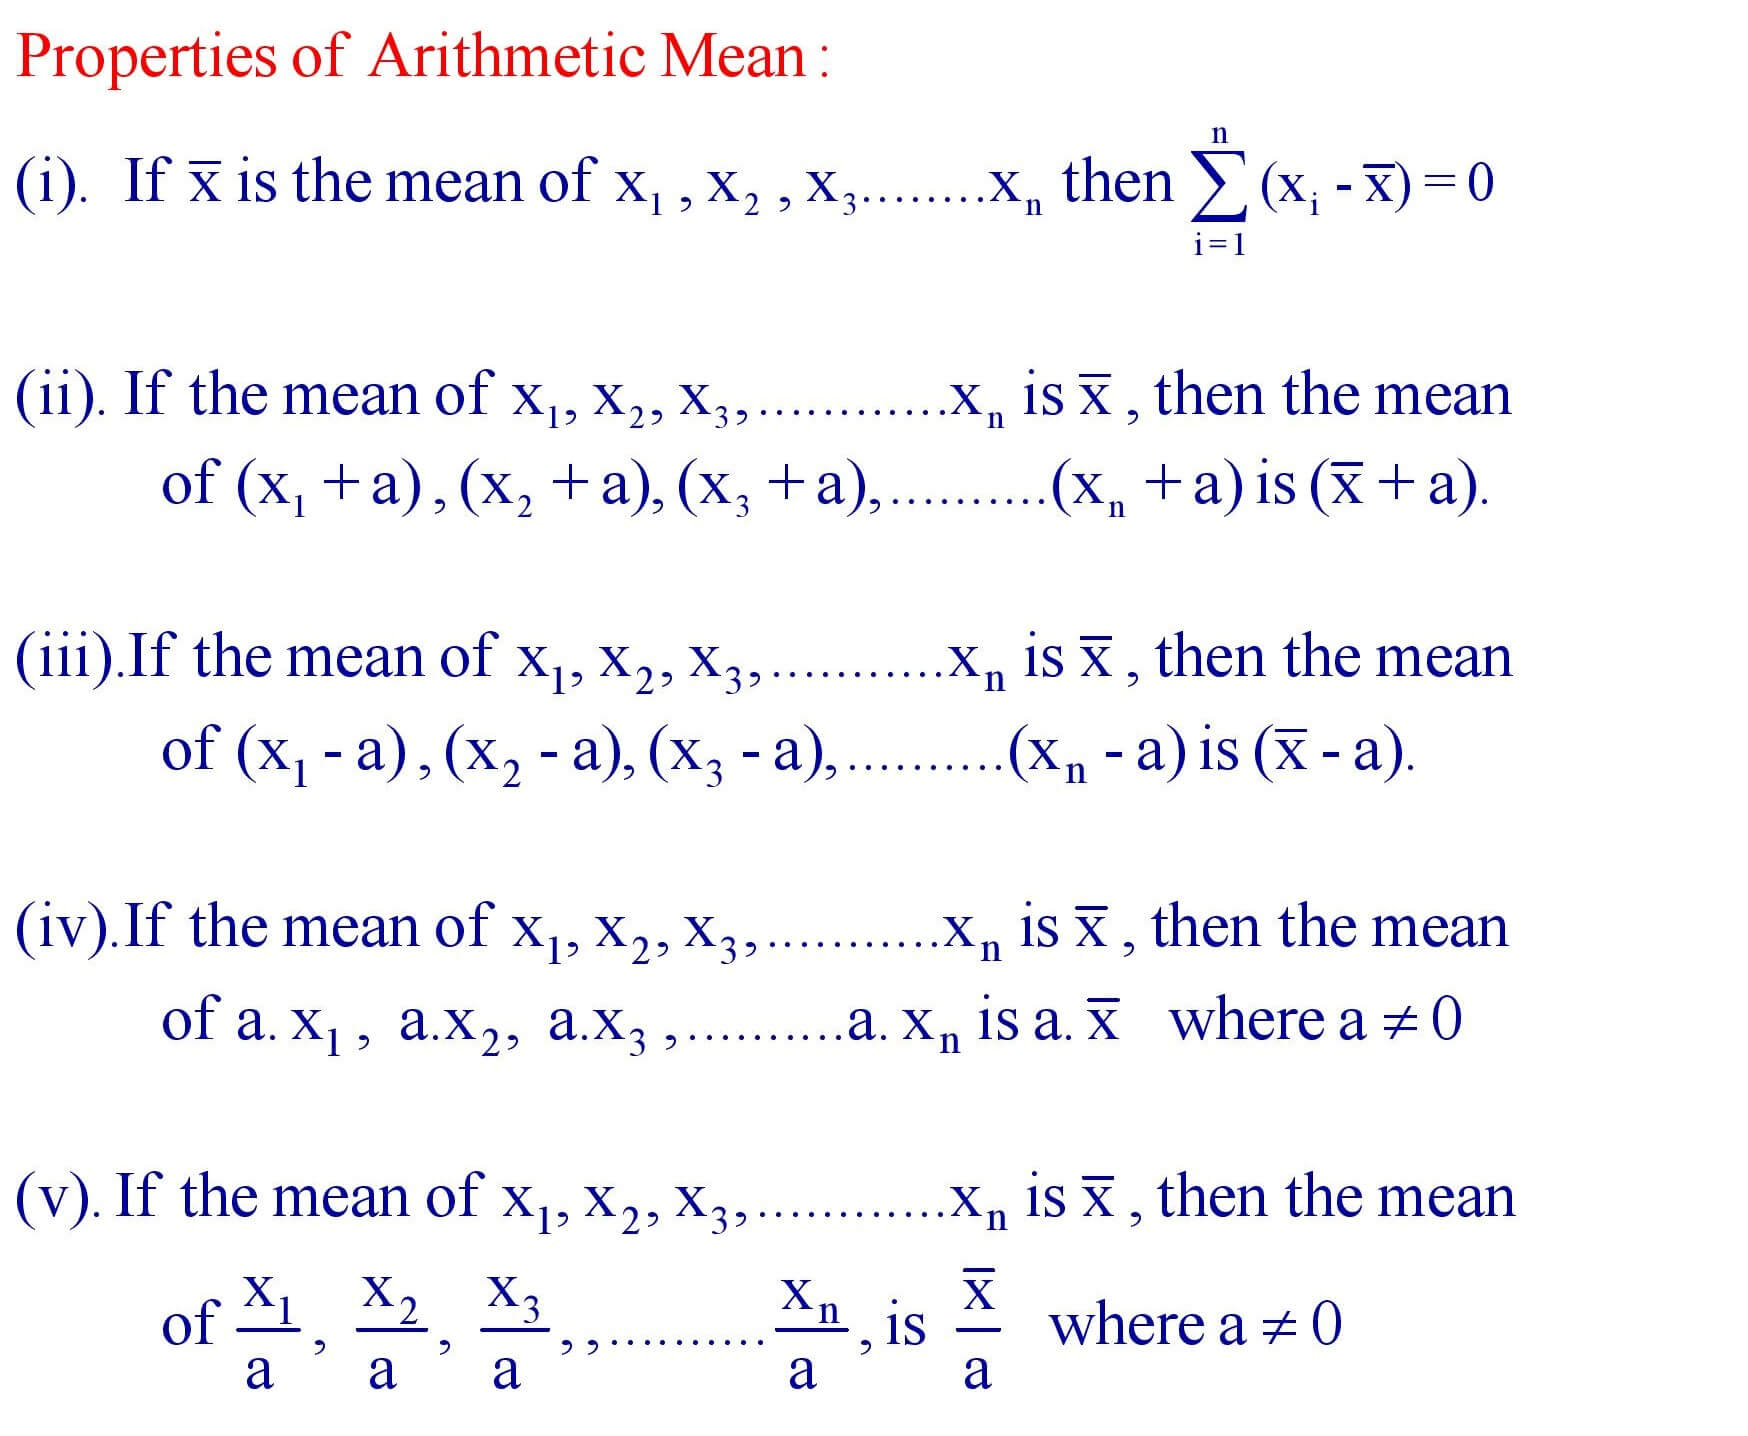
8. Properties of Arithmetic Mean.
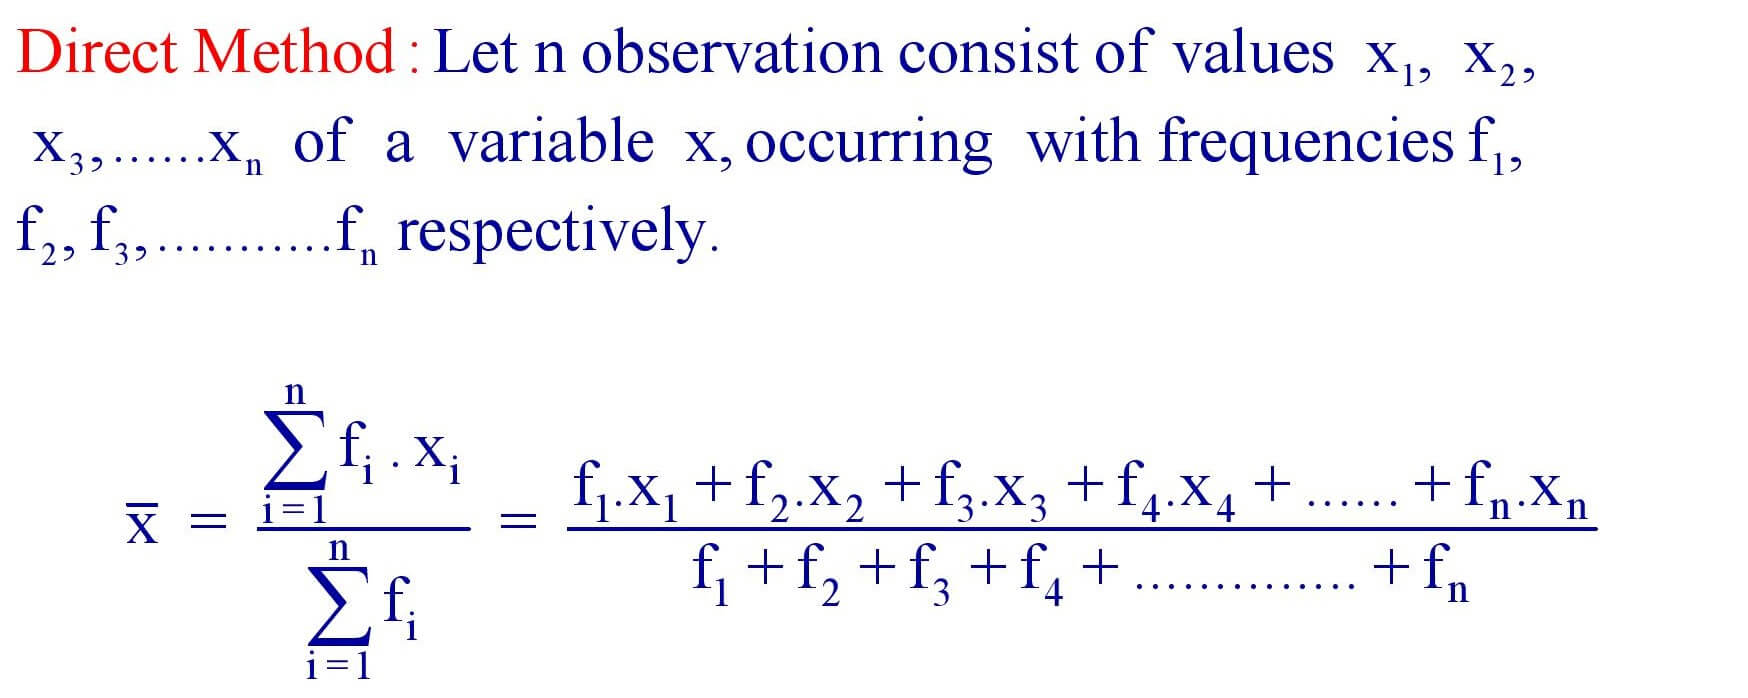
9. Mean for an ungrouped frequency distribution :
(a). Direct Method :
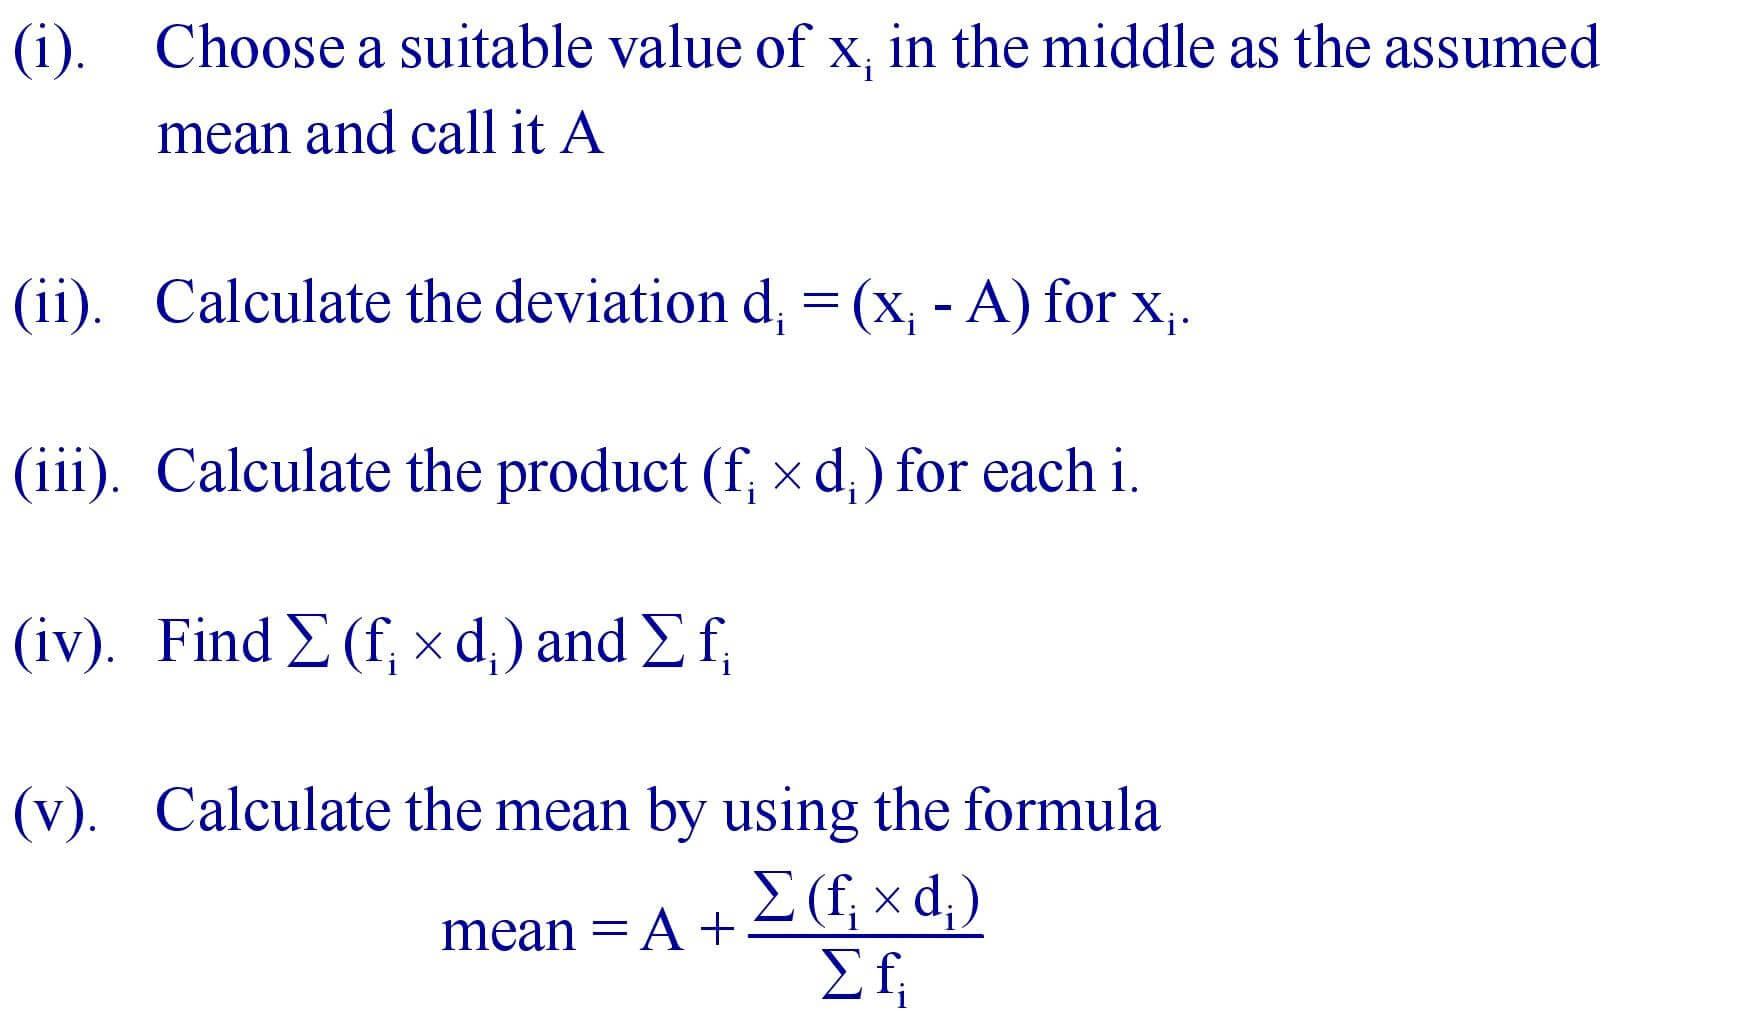
(b). Assumed – Mean Method : When the product ( f i × xi ) involves large numbers then we use the assumed – mean method.
Steps :
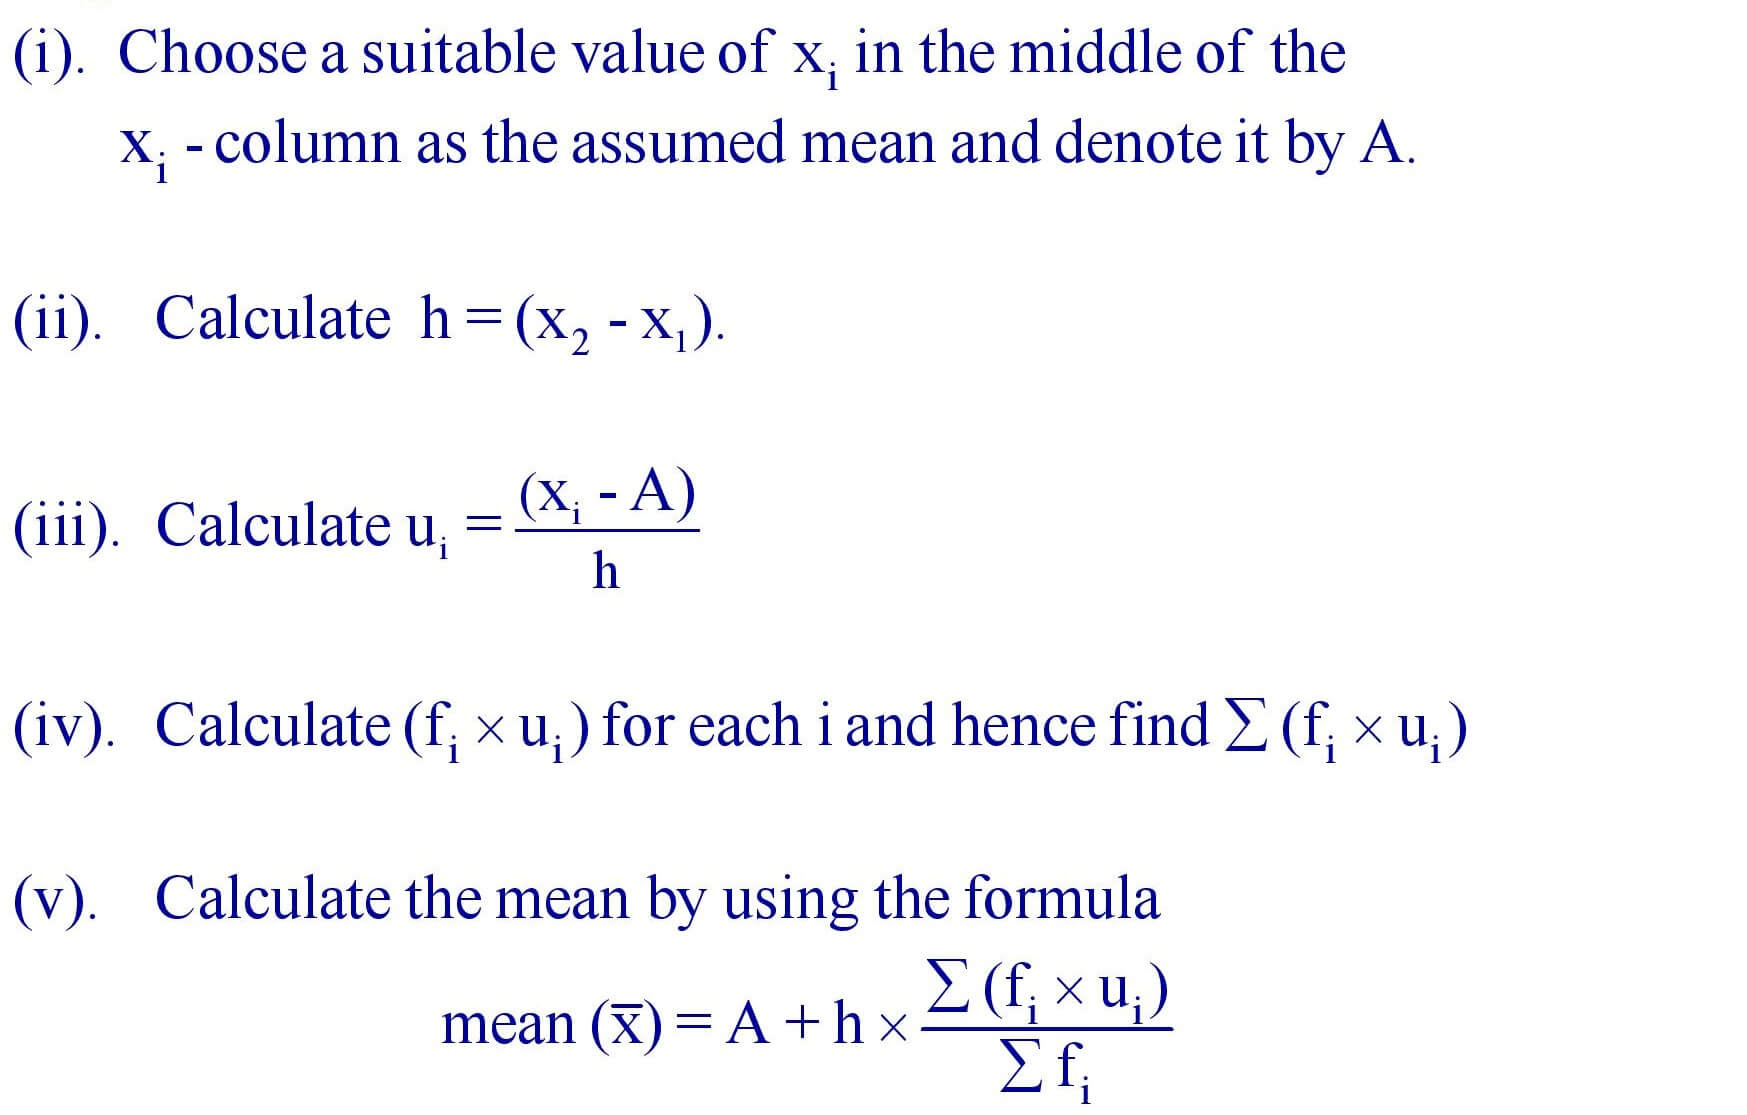
(c). Step – Deviation Method : When the values of xi and fi are large and the values of xi are equally spaced , we use the step – deviation method for finding the mean.
Steps :
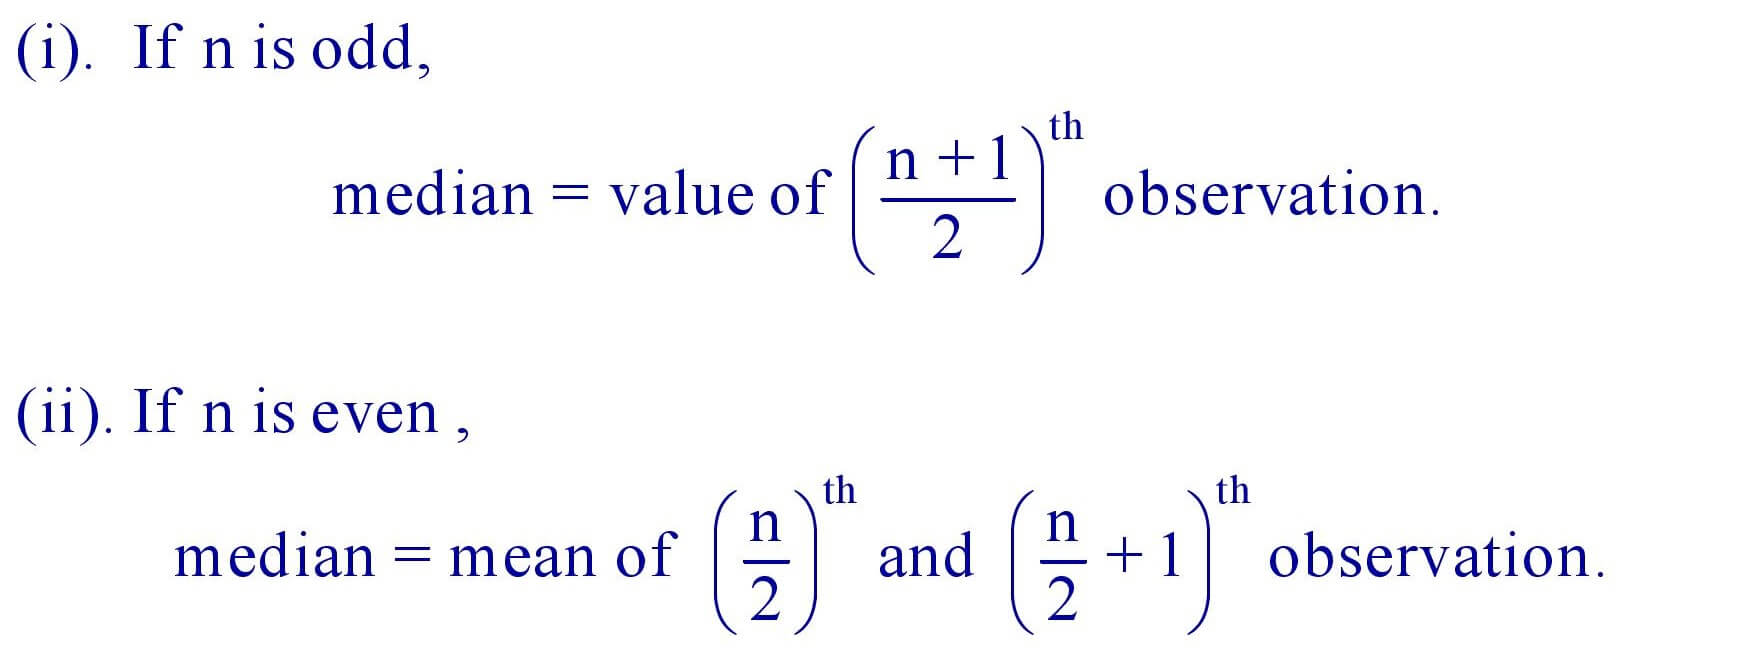
10. Median : It is the value of the middle most observation.
11. Mode is the most frequently occurring observation.
12. Mode = 3 (median ) – 2 ( mean )
| Click here to pdf download |
